Monthly service statistics
Each month we will provide statistics that will demonstrate how our services are performing. This information enables CMET to monitor and improve in all operational areas ensuring our customers enjoy an exceptional travel experience.


What do these numbers mean?


** 0 monthly passengers boardings due to the ongoing MyWay+ transition.
What do these numbers mean?
** 0 monthly passengers boardings due to the ongoing MyWay+ transition.
What do these numbers mean?
** 0 monthly passengers boardings due to the ongoing MyWay+ transition.
What do these numbers mean?
** 0 monthly passengers boardings due to the ongoing MyWay+ transition.
What do these numbers mean?
** 0 monthly passengers boardings due to the ongoing MyWay+ transition.
What do these numbers mean?
** 0 monthly passengers boardings due to the ongoing MyWay+ transition.
What do these numbers mean?
** 0 Yearly passenger boarding data due to the ongoing MyWay+ transition.
What do these numbers mean?
** 0 monthly passengers boardings due to the ongoing MyWay+ transition.
What do these numbers mean?
** 0 monthly passengers boardings due to the ongoing MyWay+ transition.
What do these numbers mean?
** 0 monthly passengers boardings due to the ongoing MyWay+ transition.
What do these numbers mean?
** 0 monthly passengers boardings due to the ongoing MyWay+ transition.
What do these numbers mean?
** 0 monthly passengers boardings due to the ongoing MyWay+ transition.
What do these numbers mean?
** 0 monthly passengers boardings due to the ongoing MyWay+ transition.
What do these numbers mean?
** 0 monthly passengers boardings due to the ongoing MyWay+ transition.
What do these numbers mean?
** 0 monthly passengers boardings due to the ongoing MyWay+ transition.
What do these numbers mean?
** 0 monthly passengers boardings due to the ongoing MyWay+ transition.
What do these numbers mean?
** 0 monthly passengers boardings due to the ongoing MyWay+ transition.
What do these numbers mean?
** 0 monthly passengers boardings due to the ongoing MyWay+ transition.
What do these numbers mean?
** 0 monthly passengers boardings due to the ongoing MyWay+ transition.
What do these numbers mean?
What do these numbers mean?
** 0 monthly passengers boardings due to the ongoing MyWay+ transition.
What do these numbers mean?
**0 monthly passengers boardings due to the Fare free travel period.
What do these numbers mean?
**0 monthly passengers boardings due to the Fare free travel period.
What do these numbers mean?
**0 monthly passengers boardings due to the Fare free travel period.
What do these numbers mean?
What do these numbers mean?
What do these numbers mean?
What do these numbers mean?
What do these numbers mean?
What do these numbers mean?
What do these numbers mean?
What do these numbers mean?
What do these numbers mean?
What do these numbers mean?
What do these numbers mean?
What do these numbers mean?
What do these numbers mean?
What do these numbers mean?
What do these numbers mean?
What do these numbers mean?
What do these numbers mean?
What do these numbers mean?
What do these numbers mean?
What do these numbers mean?
What do these numbers mean?
What do these numbers mean?
What do these numbers mean?
What do these numbers mean?
What do these numbers mean?
What do these numbers mean?
What do these numbers mean?
What do these numbers mean?
What do these numbers mean?
What do these numbers mean?
What do these numbers mean?
What do these numbers mean?
What do these numbers mean?
What do these numbers mean?
What do these numbers mean?
What do these numbers mean?
What do these numbers mean?
What do these numbers mean?
What do these numbers mean?
Low monthly passenger boardings due to ACT COVID19 lockdown from 12 August 2021.
What do these numbers mean?
What do these numbers mean?
What do these numbers mean?

What do these numbers mean?
What do these numbers mean?
What do these numbers mean?
What do these numbers mean?
What do these numbers mean?
What do these numbers mean?
What do these numbers mean?
What do these numbers mean?
What do these numbers mean?
What do these numbers mean?
What do these numbers mean?
What do these numbers mean?
What do these numbers mean?
Low monthly passenger boarding due to ACT COVID19 recovery
What do these numbers mean?
Low monthly passenger boarding due to ACT COVID19 lockdown
What do these numbers mean?
Low monthly passenger boarding due to ACT COVID19 lockdown
What do these numbers mean?
What do these numbers mean?
What do these numbers mean?
What do these numbers mean?
What do these numbers mean?
What do these numbers mean?
What do these numbers mean?
The data used to develop this page has been gathered by CMET and Transport Canberra. Below are explanations of what each figure represents and how the numbers are calculated:
Scheduled services:
The total number of planned services for the month, including additional planned services, e.g for special events.
% Services run:
The percentage of services run out of the total number of scheduled services for the month. e.g. if there were 100 services planned and 98 of them actually ran, the % services run would be 98%. This calculation includes a pro-rata rate for any partially completed services.
% Services on time:
The percentage of services that arrived on time out of the total services run. * E.g. if there were 100 services run and 98 of them arrived on time, the % services on time would be 98%
*A service is considered on time when it arrived within 2 minutes of its scheduled arrival time at predetermined timing points.
Monthly passenger boardings:
Total number of light rail passenger boarding’s during the reporting month. This data is sourced from Transport Canberra's ticketing system and includes MyWay boarding’s (tapped on) and paper tickets purchased at Light Rail stops.
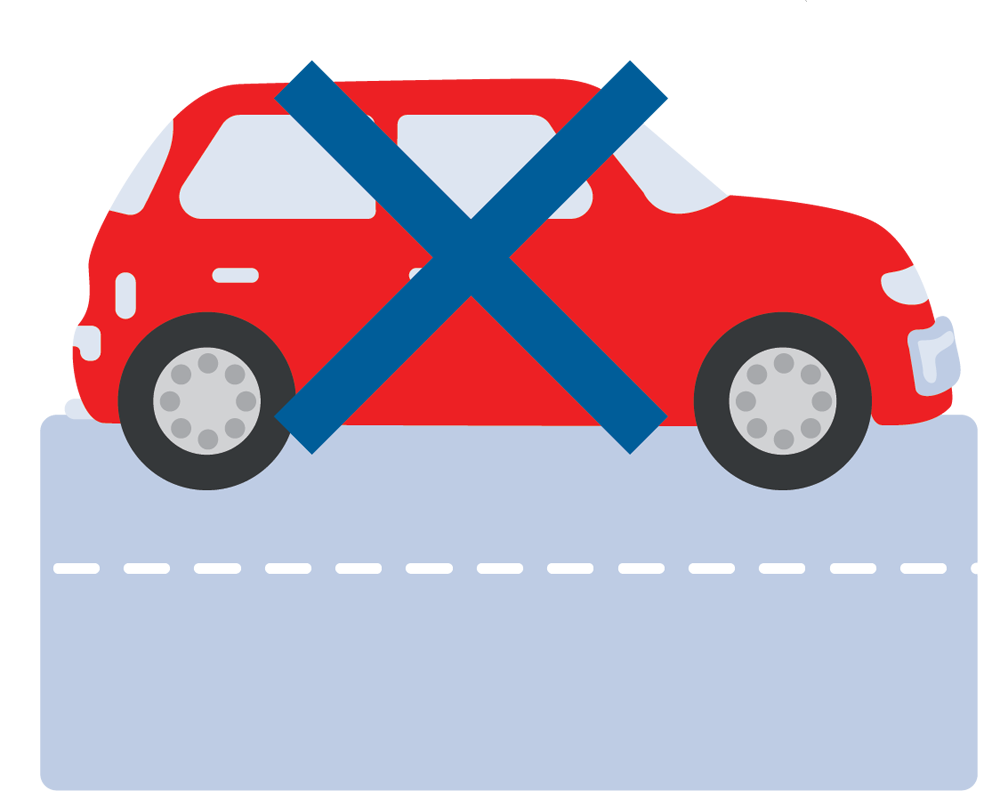
Car Trips Avoided:
Calculated by the number of monthly total passengers divided by the average amount of passengers in a car per day (*source BITRE data)
Most popular day:
Determined using MyWay and ticket data of tap ons by day
Most Popular times:
Coming soon
More information about Light Rail Patronage can be found on the ACT Open Data Portal
Year-to-date
Total passenger boardings:
A cumulative number of passengers over the calendar year. This data is sourced from Transport Canberra's ticketing system and includes MyWay boarding’s (tapped on) and paper tickets purchased at Light Rail stops
Total distance travelled:
A cumulative distance travelled by all LRVs in passenger services over the calendar year. This is the number of services multiplied by the distance of the route (12km). This includes special event services, but does not include LRVs travelling out of service.
Items in Lost Property:
Total number of items received as lost property over the year. If you have lost something on the light rail, fill in our form.
Annual facts & figures brochure
The following Facts & Figures brochure has been designed to highlight some key statistics of CMET’s first year of operations. Light Rail operations in the ACT began on 22 April, 2019.
** 0 Yearly passenger boarding data due to the ongoing MyWay+ transition.